« GPS Visualizer Tutorials
Tutorial: Building Plain-Text Waypoint Files by Hand
Contents
This document will show you how to build plain-text (tab- or commma-separated) files that can be used to make maps with GPS Visualizer. It's actually very easy to get started, but there are some powerful features that you might not be aware of. After reading this, you should have a better understanding of what GPS Visualizer can do and how you can take advantage of it.
For most of the examples on this page, we've created very simple JPEG maps. They're not very fancy, but this document isn't about spectacular maps, it's about massaging data into a mappable format. Unless otherwise noted, all the information here also applies to creating Google Maps, Leaflet maps, Google Earth files, etc. Once you have a nice, clean data file, you can do anything you want with it.
1: The bare essentials
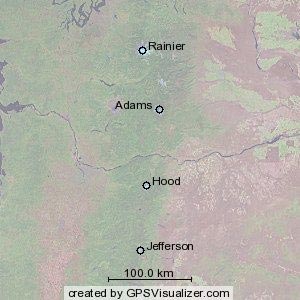
All you really need is a collection of coordinates, or even just one pair of coordinates; adding a "name" to each point is not necessary, but very helpful (and it lets GPS Visualizer know that you're uploading waypoints rather than a sequence of trackpoints).
For this example, we'll use the tallest Cascade Range volcanoes in southern Washington and Northern Oregon. The easiest way to organize your data is using a spreadsheet, like Microsoft Excel. On the left, below, is a screen shot of an Excel worksheet, and on the right is the same data in simple, comma-separated format.
To make a map from data like this, just cut and paste the data from Excel or your text editor into the text area on GPS Visualizer's map form. (When you copy data from Excel, it gets pasted with tabs, which will work fine but might look strange.) If you prefer, you can also upload the Excel file to GPS Visualizer.
|
For now, let's use the JPEG/PNG/SVG map form, with the output format set to JPEG and the size set to 300 for simplicity's sake. (Go ahead and try it using the data in the box above.) After clicking the "Draw a map" button, the resulting graphic should look similar to the map on the left.
|
Here's the most important thing that can be emphasized about creating plain-text data files for GPS Visualizer: Having a sensible "header row" above your data is VERY important. The order of the fields is NOT important. Spaces between fields and capitalization of the header row aren't important either. So "name,latitude,longitude" is identical to "NAME, latitude , Longitude." These "not important" factors are a big part of what makes this program so powerful: chances are, if a human could read your data and make sense of it, so can GPS Visualizer. Include as many or as few fields as you want; as long as a waypoint contains information that might let you plot it on a map, GPS Visualizer will try.
2: A little more information
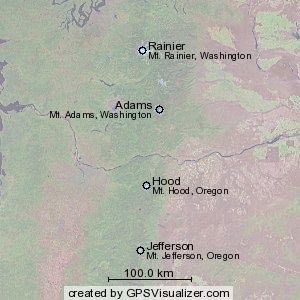
Now, let's add a "description" field to each point (usually abbreviated as "desc"). For now, we'll put the full name of the mountain, along with the state it's in. So Rainier's description is "Mount Rainier, Washington."
We'll also add a field that contains the height of each mountain. We'll call it "alt" to keep it short, but you could also use "altitude" or "elevation." NOTE: if no units are specified, GPS Visualizer will think your numbers are metric (meters for elevation, km/h for speed, etc.); but, in this example, we have our elevation data in feet, so we need to call the field "alt (feet)" or "alt (ft)".
(Click here to pre-fill the map form with this data.) There's something very important to notice about this comma-separated data: the items in the "desc" column MUST be enclosed in quotes because there is a comma inside each description. Without the quotes, everything would be shifted back one column, and the altitude of the first two points would be listed as "Washington"!
|
Voila.
|
3: Building more interesting "desc" fields
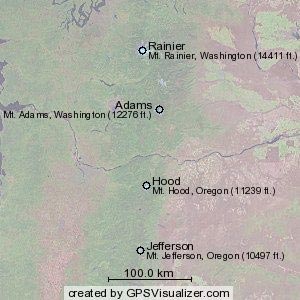
The nice thing about storing your raw data in a spreadsheet like Excel is that you can manipulate the fields as needed. This is especially helpful for the description field. Let's say we want to display the height of each mountain on the map. All we have to do is concoct a simple Excel formula that reads the "alt" field and adds it to the end of the existing "desc" field. Since the column with the formulas in it will need to be called "desc" in order for GPS Visualizer to recognize it, we'll rename the original "desc" column to "full name," which GPS Visualizer will ignore.
In the screen shot below, you can see the formula in cell C2 laid bare for the world to see; in cells C3 through C5, the results of the formula are visible.
(Click here to pre-fill the map form with this data.)
|
Maybe we should have just put the altitude by itself in the description field; it's getting a little messy. Oh well, there's no harm in experimenting.
Note that if your output format supports HTML in waypoint names or descriptions (i.e., you are creating a Leaflet map, a Google Map, or a Google Earth KML file) you can build descriptions that contain HTML formatting, which can be very, very useful. For example, you can include line breaks via the <br/> tag; in fact, you could conceivably include an entire table of information in the description of each point.
One more thing: you can give instructions to GPS Visualizer to synthesize a name or description based on your fields (look for synthesize name and synthesize description in the "Advanced waypoint options"). With this feature, you can create interesting names and descriptions without having to use Excel formulas. (Click here for an example using dynamic data and the "synthesize" variables.)
|
4: Adding colors
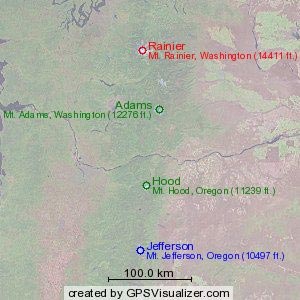
Each of your points can have its own color, defined by a "color" field. In our example data, we'll assign red to peaks over 14,000 feet high, green to peaks that are at least 11,000 feet, and blue to the rest.
(Click here to pre-fill the map form with this data.)
|
Colors can be either "named" HTML color values (blue, green, red, black, fuchsia, olive, skyblue, papayawhip, etc.) or hex-formatted RGB values (#0000FF, #82B3CE, etc.).
And yes, "papayawhip" is really a recognized HTML color.
|
5: Adding symbols in HTML maps & Google Earth
Now we're going to turn away from those simple JPEG maps for a moment, because in JPEG, PNG, and SVG maps, you have no control over what kind of marker ("symbol") appears for each waypoint; it's always a circle. In Leaflet, Google Maps, and Google Earth, however, you can use a different marker style, either for all points or each point individually.
So, let's make a map using triangles and squares. We'll say that triangles represent volcanoes that have erupted in historic time (Rainier & Hood), and squares are volcanoes that have been dormant longer (Adams & Jefferson).
(Click here to pre-fill the map input form with this data.)
|
|
The map on the left is a live, interactive map; note that if you put your mouse pointer over one of the markers, the name shows up. If you click on a marker, an info window pops up with the name of the point in bold at the top, and the description below. (This is where including HTML in a description could come in handy.)
|
Custom icons in Google & Leaflet Maps
GPS Visualizer accepts absolute URLs in the "symbol" field for Leaflet & Google maps, and it will try its best to make your custom symbols display properly without you doing any extra work. (However: if you also supply an "icon_size" field that contains something like "12x20", you'll make GPS Visualizer's task a little easier.)
If you need to, you can also define a whole set of custom markers in various colors, but for each new marker you need to create the main graphic (and an optional "shadow"), and then repeat the process for however many different colors you want available. Then you have to add some JavaScript code to the guts of your map page that defines certain parameters of the new icon. It's powerful, but a pain to set up; send an e-mail if you want to give it a try.
Custom icons in Google Earth
Google Earth makes it very easy to incorporate custom icons into your maps: all you need to supply is the URL of the icon graphic (even photograph thumbnails will work), and GE will take care of the rest. Google Earth can even colorize them if you supply a "color" field.
Google Earth also has hundreds of "standard" icons that you can easily use. To see all of them, click here; to find the URL of one of the icons on that page, right-click on the graphic and choose the appropriate command to find its URL. (In Firefox, it's "Copy image location.")
Invisible icons
When making both Leaflet/Google Maps and Google Earth files, GPS Visualizer lets you create "invisible" waypoints by specifying "no icon" or "none" in the symbol field. This could be useful if you want to put a visible label on a track in Google Earth (something GE does not normally allow), or to put any sort of label on a map without a specific icon attached to it.
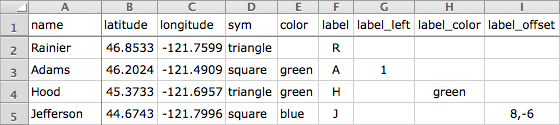
6: Adding permanent labels to HTML maps
|
|
In the map on the left, the markers will show you their names when you move your mouse over them, but they also have a different piece of text (in this case, their first letter) permanently visible on the map as a "label."
The top label ("R") shows the default appearance: the label is on the right side of the marker, roughly centered vertically with respect to the marker's anchor point. The others have customizations applied to them:
- "A" has a label_left:true attribute, so the label appears on the left side. (label_centered is also an option; in that case, the label appears below the marker, horizontally centered.)
- "H" has label_color:green, so the label's appearance is white with green text instead of the default black with white text. (Another option for customizing the appearance of an individual label's text is the label_class attribute, which takes the name of a CSS class that you define.)
- "J" has label_offset:[8,-6], which means the label is offset 8 pixels to the right and 6 pixels up from its default position. If you put an offset in comma-separated data, be sure to put quotes around the pair of numbers so they are treated as a single field ("x,y").
|
(Click here to pre-fill the map input form with this data.)
7: Resizing & colorizing points
Using the "quantitative data" input form, you can have GPS Visualizer resize or colorize your waypoints based on a field (or fields) of your choice. It's not hard to do, but this feature is important enough to warrant its own tutorial.
8: Adding points without coordinates (e.g., addresses)
It's possible to specify the location of a waypoint using information other than coordinates: city+state, U.S. ZIP code, Canadian postal code, or airport code. (For street addresses, you will need to use GPS Visualizer's Batch Geocoder to add coordinates to your points before proceeding.)
As always, the header row on your data is important, and preserving the structure of the columns is crucial: you can't put an airport code in the "latitude" column or a city name under "airport." In this next example, we've added Seattle and Portland to the file, using two different methods. For Seattle, we've supplied a city and state; for Portland, just its airport code. The unknown fields are left blank. (In the .csv data file, that means multiple commas with nothing between them.)
(Click here to pre-fill the map input form with this data.)
|
|
The resulting map is just as you'd expect: a yellow pin on Seattle, and a yellow airport icon on Portland (at the location of PDX, Portland's airport).
If you want to retrieve the coordinates of points for which you don't know the latitude and longitude, send your data through GPS Visualizer's geocoding utilities rather than the map form.
|
9: Adding URLs to waypoints
If your input data includes a "url" field, the point's info window will contain a link to that URL. (In SVG maps, the marker itself becomes a link.)
10: Adding thumbnails and photos to waypoints
If you include the URL of an image in a waypoint's "thumbnail" field when creating a Leaflet or Google Map, it will show up when you mouse-over the waypoint marker, and will also appear in the info window that appears when you click on the marker. The thumbnails will be displayed at their natural size unless you also supply a "thumbnail_width" value (in pixels).
If you include an image's URL in the "photo" field, that image will appear full-size in the marker's info window. (If there is also a thumbnail specified, the thumbnail will NOT appear in the info window.) Use two numbers in the "photo_size" field to set the displayed size of the image (e.g., "400x300").
You can see an example of a photo map here.
11: Summary
Here's a list of the fields that are important in terms of how GPS Visualizer handles your waypoints. Alternate names are separated by slashes; for example, you can specify latitude with "lat" or "latitude."
(For a "live" demonstration of how many of these fields work with HTML maps (Google/Leaflet), click here.)
| name | the name of a point, as displayed on the map; use "-" for no name. In Leaflet/Google Maps and Google Earth, the name is used as the "mouseover" text for the marker. |
| desc/description | can contain almost anything, especially if your goal is Leaflet/Google Maps or Google Earth files; use "-" for no description |
| longitude/lon/long | ideally should be decimal degrees, but degrees-minutes-seconds format also works as long as the parts are separated (just be sure that western coordinates are either negative numbers or include a "W") |
| latitude/lat | see note under "longitude" |
| time/date | try to use a non-ambiguous time format, like yyyy-mm-dd hh:mm:ss; if you submit "04/05/06," the computer doesn't know what that means |
| alt/altitude/elevation | will be interpreted as meters unless "(ft.)" or "(feet)" is included in the field name |
| speed/velocity | will be interpreted as km/h unless "(mph)" or "(m/s)" is included in the field name |
| airport | 3- or 4-letter airport code; used in place of latitude & longitude |
| color | named HTML color or hex value; in Leaflet/Google Maps, you can only colorize GPS Visualizer's built-in icon sets, not remote icons |
| hotspot | Google Earth only; two numbers joined by a comma (x & y; y=0 is the bottom of the icon); used for custom placemark icons. (In Leaflet/Google Maps, use icon_anchor, where y=0 is the TOP of the icon) |
| sym/symbol/icon | Leaflet/Google Maps or Google Earth only; see "Adding symbols" above |
| radius | in pixels |
| scale | a ratio (0.5 = half-size, 2.0 = double-sized) |
| opacity | from 0 to 1 |
| rotation | degrees clockwise (same units as a "heading" would be); can be used with any icon in Google Earth, or with the "tickmark" icon in Leaflet/Google Maps |
| url | turns your waypoint into a link; see "Adding URLs" above |
| label | Leaflet/Google Maps only; puts a "permanent" label on the map rather than just a tooltip. |
| label_color | Leaflet/Google Maps or Google Earth only; sets the color of a marker's permanent label on the map. |
| label_scale | Google Earth only; sets the size for a marker's label on the map, as a percentage/proportion of the "normal" size. |
| shortdesc | Leaflet/Google Maps or Google Earth only; if you have your Google Map generate a marker list that includes descriptions, the "shortdesc", if it exists, will be used in place of the normal "desc" in the list. In Google Earth, the short description will go in the KML <snippet> tag, which is displayed in GE's sidebar. |
| thumbnail | the URL of a graphic; in Leaflet/Google Maps, it becomes part of the mouse-over; in Google Earth, it becomes the icon for that point (see #9 above) |
| photo | the URL of a larger photo; in Leaflet/Google Maps & Google Earth, it becomes part of the description of the point |
| address, city, state, country/nation | used in place of latitude & longitude; does not work with dynamic maps |
| zip/zipcode/postcode | used in place of latitude & longitude; does not work with dynamic maps |
| folder | Leaflet/Google Maps (with a "marker list") & Google Earth only; you can create collapsible/hideable folders of waypoints and/or tracks if you provide the name of a folder. In Google Earth, you can go one level deeper by separating folders and subfolders by backslashes; for example, you could use "Campgrounds\Public" and "Campgrounds\Private", and a Campgrounds folder would be created, with Public and Private folders inside. |
| circle_radius | This is an unusual one. If you supply a distance in the circle_radius field (e.g., "10 km" or "100 mi."), GPS Visualizer will draw a "range ring" of the specified radius around your point. Note that if your waypoint has a color or opacity supplied, those attributes will be applied to the circle. (If you don't supply a unit, the number given will be assumed to be kilometers.) |
| Leaflet/Google Maps options |
These are included in a separate section because they're a bit esoteric and ONLY used with Leaflet/Google Maps.
| variable | description |
|---|
| icon_size | The size, in pixels, of a custom (remote) icon in "width,height" format; this will speed up processing of your map because GPS Visualizer doesn't have to go out and "inspect" the icon graphic. |
| icon_offset | Relative X and Y coordinates of the placement of the icon on the map (e.g., "10,10"). Numbers increase rightward and downward. |
| icon_anchor | Relative X and Y coordinates of the "anchor" of the marker's icon (e.g., "7,15"). Numbers increase rightward and downward. |
| label_offset | Relative offset, in X and Y pixels, of a marker's "permanent" label, (e.g., "2,-4). Numbers increase rightward and downward; overrides the global "label_offset" option. Frankly, it's often better to edit this manually after the map is created. |
| label_left | A value of "true" (or 1) causes a marker's label to appear on the left side of the icon instead of the right. |
| label_centered | A value of "true" (or 1) causes a marker's label to appear centered below the icon. |
| label_class | The name of a CSS class to be applied to a marker's permanent label. You can use this to cause certain labels to have a different size, color, or font. (Make sure to include style sheet definitions somewhere on the page. Note that you'll need to define them with "#gmap_div .my_class_name" and put "!important" after any font attributes; otherwise Google's fonts will override everything.) |
| z_index | By default, more southerly icons will display on top of northerly ones. You can override this with a "z_index" parameter on some or all waypoints. |
| thumbnail_width | Sets the displayed width, in pixels, of the thumbnail graphic specified in the "thumbnail" field. |
| photo_size | Sets the displayed width and height, in pixels (e.g., "500x375"), of the image specified in the "photo" field that will be displayed in the info window. |
| window_width | Width, in pixels, of the info window that pops up when you click a point; overrides the global "info_window_width" option. |
| no_window | Set to "true" (or 1) you want a marker to not open a pop-up info window when you click on it. If you specify no_window, and your marker has a URL attached to it, clicking on the marker's icon will open that URL immediately. |
| zoom_level | Sets the Google zoom level (generally 0-19) for this marker when its name or icon is clicked in the marker list; only has an effect if a marker list exists and if gv_options['marker_list_options']['zoom'] is set to true. Overrides the global zoom_level setting in marker_list_options. |
| nolist | Set to "true" (or 1) you want to exclude a marker from an auto-generated marker list. (nolist:false has no effect on anything). |
| dd | "true" or "false"; adds or suppresses a "driving directions" form in the marker's info window; overrides the global "dd" option. |
| dd_lon & dd_lat | Sometimes, you want the driving directions for a point to end up at a slightly different location than the point itself; use dd_lat and dd_lon to supply coordinates for the driving directions form. Both coordinates must be present to have any effect. |
| gv_track_number | You can make a waypoint "belong" to a track so that when the track is hidden, the waypoint goes with it. Supply the number of a track (1 or greater). |
| gv_marker_options | Fields that could be included as separate columns in your input data can also be included as a gv_marker_options attribute, which may be easier if there are only a handful of points that need special treatment. Example of a possible entry in a gv_marker_options column: dd:true,label:'parking',label_offset:[-1,5] -- but note that if you get the JavaScript syntax wrong, your entire map could fail to display! |
|
[Return to top]
[Return to the Tutorials index]
Return to the main GPS Visualizer page
|


![adam [at] gpsvisualizer [dot] com](/images/email-11.png) .
.